Forskjellen mellom Lexplore Score og Persentiler.
Lexplore scoren er et mål, mens persentilen representerer en sammenligning. Les mer om det her.
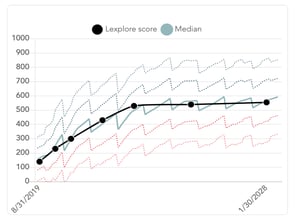
Lexplore scoren er et mål på leseevne. Den inkluderer både avkoding og leseforståelse. Målet uttrykkes på en skala mellom 0-1000. Den laveste verdien tilsvarer en elev som nettopp begynner å lese eller en elev som ikke kan lese i det hele tatt, mens den høyeste tilsvarer en veldig god leser ved slutten av hele skolegangen.

Kurven for leseutvikling beskriver hvordan Lexplore scoren endrer seg over tid. Mediankurven viser hvilken Lexplore score en gjennomsnittselev har på et gitt tidspunkt. Hvis en elev følger sin leseutviklingskurve, utvikler de seg i samme tempo som alle andre, og leseevnen deres vil øke. Men hvis elevens leseutvikling ikke går fremover i samme tempo og forblir innenfor gjennomsnittskurven, vil persentilen forbli den samme.
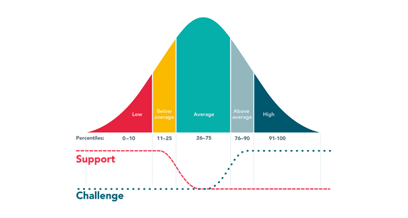
Hvis elevens lesing utvikler seg saktere enn deres jevnaldrende, vil persentilen falle; hvis eleven utvikler seg raskere enn andre, vil persentilen stige.

Persentilverdien viser hvordan en elevs Lexplore score forholder seg til andre elever på et gitt tidspunkt. Hvis en elev leser bedre enn 10% av alle elever, får de persentil 10, og hvis en elev leser bedre enn 90% av alle elever, får de persentil 90. En gjennomsnittselev vil få persentil 50, fordi deres Lexplore score tilsvarer gjennomsnittet for alle andre elever på samme tid.
For å følge opp en enkelteleves fremgang, kan læreren se på Lexplore scoren. For å se lesnivået til en klasse/skole/elev i forhold til gjennomsnittet i deres land, kan man se på persentilen.
Du kan lese mer om emnene her:
Lesemodenhet og Lexplore Score
🛎️Her hos Lexplore elsker vi å hjelpe brukerne våre med deres spørsmål og tilbyr selvhjelpsguider for raskere service. Vennligst stem nedenfor på spørsmålet om denne artikkelen var nyttig. 😊