Det samlede resultatet for hver elev presenteres i én av våre fem lesenivåer:
- Lav
- Under gjennomsnittet
- Gjennomsnittlig
- Over gjennomsnittet
- Høyt
Hver elev får en total persentilscore innenfor ett av fem fargede nivåer, som varierer fra 0-100 der 1 er et svært lavt nivå og 100 er det høyeste resultatet.
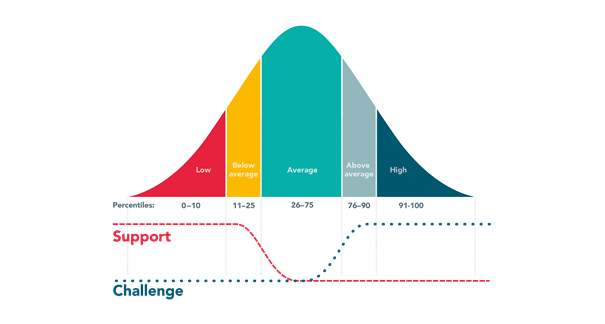
Hver elev får en total persentilscore innenfor ett av fem fargede nivåer, som varierer fra 0-100 der 1 er et svært lavt nivå og 100 er det høyeste resultatet. Disse er modellert over en normalfordelingskurve, hvor elevens samlede persentil sammenlignes med barn i samme årstrinn. Det gis også individuelle målinger for hver lese- komponent og vises sammen med tidligere resultater, skolens gjennomsnitt, og det nasjonale gjennomsnittet. Individuell måling kan finnes i elevens Lexplore-score.
Resultater kan vises på 5 nivåer:
- Organisasjonsnivå
- Skolenivå
- Klassenivå
- Elevnivå og til og med
- etter årstrinn
Det gir en klar oversikt over elevenes leseevne på hvert nivå.
Innenfor hver elevs lesingsprofil kan lærere finne en visuell representasjon av leseprosessen ved å se på elevenes øyebevegelsesopptak, slik at de kan se og høre elevene mens de leser.
Resultatene presenteres i Lexplores sikre Resultatportal der brukerrettigheter kontrollerer tilgang til data.