Results on the student overview are displayed as follows:
Percentile Scores
Each pupil’s reading attainment is shown as a percentile score within five coloured reading levels: (1) Low, (2) Below average, (3) Average, (4) Above average and (5) High. These percentiles can be used to compare where each pupil lies in comparison to others the same age in the normal distribution. Within each pupil’s results you will also find dedicated support and intervention material aligned to their reading level.
Low
Approximately 10% of the pupils have results on this level. They have significantly reduced reading ability compared to their peers. Reading ability on this level is an impediment to schooling and school performance. There is also a great risk that their reading difficulties will negatively impact their self-esteem and motivation to learn. These pupils need individual support and targeted intervention to get underway with their reading.
Below Average
Approximately 15% of the pupils have results on this level with the Lexplore test. Their reading ability results are below average compared to their peers. This means that they need help getting underway with their reading to ensure that their school performance is not negatively impacted. Reading difficulties can negatively affect self-esteem and motivation to learn.
Average
This reading level constitutes the average for the respective year level. Approximately 50% of the pupils have results on this level with the Lexplore test. They have good decoding skills in line with their peers. If a pupil with results on this level keeps developing his/her reading skills through practice, the reading ability will not be an impediment to school performance, self-esteem and motivation to learn.
Above Average
Approximately 15% of the pupils have results on this level with the Lexplore test. Their reading ability results are above average compared to their peers. A pupil with results on this level has good decoding skills and reads fluently. The pupil´s result on the Lexplore Reading Ability Test indicate good prerequisites for academic success.
High
Approximately 10% of the pupils have results on this level with the Lexplore test. Their results are significantly higher in comparison with their peers. A pupil with results at this level is a very good fluent reader. Their results indicate very good prerequisite for academic success.
Emergent Reader
Emergent reader is a new level for pupils in Year 2 who are not able to complete the texts. Examiners will be given an option to mark ’not reading yet’ when cancelling or ending a test. It is visualised in the result portal within the aggregated statistics. The big difference is that there is no percentile or other metrics such as reading speed. However, visualisations and comprehension answers still provide useful information for teachers.


Reading age
The Reading Age score is the level of reading ability that a pupil has in comparison to an average pupil of a particular age. As an example, a pupil with a Reading Age of 7:01 has performed on the Lexplore assessment as an average pupil who is 7 years and 1 month old. This can be compared to the pupil’s actual test age.
Year Level Equivalent
YLE is similar to reading age but instead of comparing a pupil’s reading ability against the average for their age group, it is compared against the average for their year level. For example, a student with YLE 2.1 is performing at the average level for a pupil in year 2,month 1 (September).
In the Portal YLE is presented numerically in the class list and on the heading in the pupil view. YLE will also be available in the drop-down menu next to the eye movement recordings.
Standard Scores
The Standard score is an alternative measure to percentiles. At the end of the academic year many teachers are required to produce standardised scores to show where their pupils lie in relation to national averages. Although Lexplore percentiles act as stand-alone scores, they are based upon the TOWRE 2 benchmarking system and are automatically converted to standard scores within each pupil’s reading profile.
Percentile 1 = Standard score 62
Percentile 100 = Standard score 155
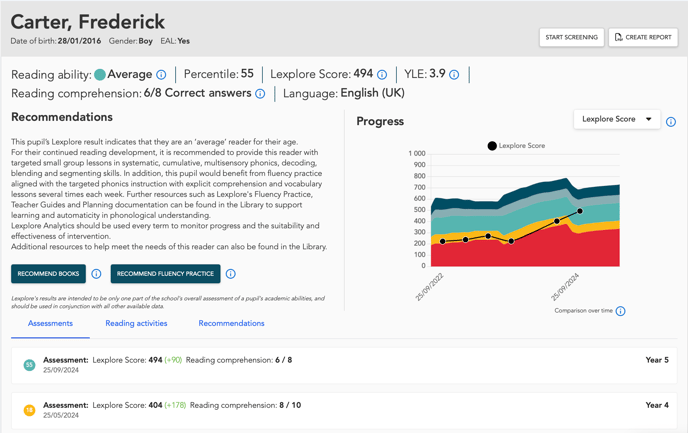
The Lexplore Score
The Lexplore score has been developed to measure and visualise a pupil’s individual reading development over time. It is an absolute measure on a scale (0-1000), without a unit.
The score is based on the absolute measure of the two texts. The absolute measure is the output from our machine learning model, which provides a prediction of words correct per minute. On each student’s result page, the Lexplore Score can also be viewed graphically. The first and last test date is presented on the x-axis. All results obtained between are presented as dots. The distance between each result reflect the true time between each test date.

Results on the assessment overview are displayed as follows:

Reading Speed
Reading speed describes how quickly a pupil reads a text. The results are given in words per minute. It is important to point out that the pupils are not encouraged to read as quickly as possible. Instead, our assessment actually offers an insight into a pupil’s spontaneous, natural reading speed. This means that scores might differ from those obtained during other timed tests.
Reading speed has proven useful for teachers building a picture of candidate needs for exam access arrangements. Therefore, results for both out loud and silent reading are displayed alongside a pupil’s overall reading profile.
Rapid Naming
Rapid naming measures how quickly a pupil can name letters, measured in letters per minute. Lexplore’s method does not use rapid naming as a parameter in judging overall reading ability, but does use it as a check if pupil’s are able to read the two simple reading tasks which follow.
Saccadic Length
Saccades measure the distance, either forwards or backwards, between two fixation points. An individual with reading and writing difficulties reads with shorter saccadic movements than the typical reader does. Scores for saccadic length are given as an average based on the number of characters. Saccades are also represented by lines in our eye movement visualisations. Longer lines often indicate that pupils are reading with greater fluency as their eyes move across the text without pausing to decode each individual word or returning to previous parts of the text, known as regression.
Regression Frequency
Regression frequency is a measure of the number of regressive saccades in relation to the total number of saccades (backward and forward eye movements in the text). Reading and writing difficulties entail more frequent regressive saccades. Deviant regression and eye movements can also potentially be indicators of visual processing and reading difficulties.
Fixation Time
Fixations occur when the pupil’s eyes rest in order to decode a word and work through the text. We take in and process the information we see during fixations. Long fixation times are one indication of reading and writing difficulties. Within our eye movement visualisations, circles are used to represent fixations. The larger the circle, the more a pupil struggles to decode a word.
Each pupil is provided with decoding score based on their average fixation time in milliseconds (ms). Fixation times are also given for each word within both texts. This allows teachers to clearly see if pupils are struggling to decode particular words, phonemes or graphemes.
During the reading comprehension segment of the test, the pupil verbally describes simple details in the text by responding to a few brief questions. Great care has been taken to ensure that the questions are easy to understand and never more difficult than the text itself, so that the pupil’s responses accurately reflect what he or she remembers from the text. Each pupil’s comprehension results are displayed within their profile for comparison. The Lexplore algorithm for calculating reading ability is based on a formula where words correct per minute (WCPM) or fluency, is weighed 80% versus 20% for Reading Comprehension.
What do overall percentile scores mean?
Results from the Lexplore assessment are given as an overall percentile within five different reading levels on a normal distribution curve. With many schools used to manually evaluating reading, it is useful to breakdown exactly what this means to help teachers make improved interpretations for their own pupils.
Normal distribution curves are used frequently in many different contexts, not just within education. Data is normally distributed when it is symmetrical around a central value, the mean, median and mode of the data set. When compiled in a histogram this data set forms the normal distribution or bell curve below. This curve appears like a hill with different peaks depending on the standard deviation.
The mean is always in the centre of the curve; the greater the distance between the mean and any point, the further away from the mean it is. Half of those within the distribution will be lower than the average and half will be higher. The largest group therefore lies in the middle of the curve groups then become smaller the further you move in either direction from the mean.
As many assessments only look at the reading components in isolation of one another it can be difficult for teachers to pinpoint exactly which area of reading a child is struggling with. By measuring how the reading components work together, we can offer teachers a new and objective analysis of a child’s natural reading ability by incorporating all the main cognitive processes involved. Each pupil’s overall result can then be broken down within the Results Portal into their individual components to highlight specific areas needing support and provide a more granular analysis.
Percentiles
Each group within the normal distribution can be divided into percentile values. These range from 0 to 100 and give a much more precise picture of where a pupil lies in relation to the entire data set. At the 75th percentile, for example, 75 % of the group falls below and the other 25 % over. The central (Average) group of the Lexplore normal distribution is for those pupils with a percentile score between 26 and 75. When it comes to monitoring progress throughout the year, repeat testing might result in pupils remaining within the same reading level, but their percentile score may indicate small progressions or regressions within that group. As the Lexplore assessment is able to take into account the natural progressions a pupil makes through the year, even those remaining on the same percentile scores will have progressed as expected for their specific age group.
A simple view of reading
The simple view of reading is a formula which demonstrates the widely accepted view that reading has two main components: word recognition (decoding) and language comprehension. The Simple View formula has been supported and validated by a number of research studies showing that student’s need strong decoding and language skills in order to achieve strong reading comprehension.
Based on research and analysed data, the algorithm we use to calculate reading ability aligns with the Simple View of Reading. The formula below describes how reading comprehension is used to adjust the WCPM score. Fluency, which is based on words correct per minute (WCPM), is weighed 80% versus 20% for Reading Comprehension. This aligns well with previous research and our own data.
For example, if a student has 10/10 correct answers, will their WCPM increase by approx. 2-6%
*Note: adjusted WCPM is calculated for text one and two separately and then mapped into percentile scores. The student’s main result is then calculated as an average across the two texts.
Important points to remember
Results take into account natural reading progression.
Not only does the Lexplore assessment tailor tests to a pupil’s year group, the Lexplore algorithms themselves are trained to take into account natural progression throughout the academic year. Therefore, a pupil’s percentile is determined based upon their specific place in the normal distribution when compared to pupils of the same age at that exact point in the academic year, giving much more accurate results. The expected development can be represented as steps. With Lexplore, expected development is monitored monthly unlike standard assessments where expected development can be annual. The steps are, therefore, more numerous and the gap between them shorter meaning results are much more precise.
Percentile values may remain constant despite reading progression.
As Lexplore’s AI reading analysis takes into account the natural progression a pupil will make throughout the academic year, repeat testing may result in a pupil remaining with the same percentile score. However, this does not mean that they have made no improvement following efforts and guidance, but rather that they have made the expected progress in the time between assessments.
Tests can be carried out at any point throughout the year.
We have moved away from having two fixed testing periods at the beginning and end of the school year, meaning it is now possible to test pupils at any point throughout the year. Each time a pupil is tested, the data is compared against more than 9,000 other pupils whose data has been collected from September year 2 to June Year 10. For each calendar month, the data is compared against results one month before and after the test date. The general guideline is still to wait at least 3 months between each test session to allow children to progress with your support.
How are the results determined?
When a pupil reads the texts in the Lexplore assessment, the eye tracker records their eye movements 90 times per second. Once the assessment has finished, their eye movement patterns are sent for machine learning analysis where they are compared to patterns from thousands of other recording to predict words correct per minute (fluency). Based on correlations, the patterns are interpreted using Lexplore’s algorithms and results are then adjusted using our WCPM formula to take into account the pupil’s comprehension score and presented in a normal distribution as a percentile value.
Each analysis is also based on the results from reference tests, such as character and word chains, rapid naming, and reading of non-words. Results from these tests were used during the initial development and training of Lexplore’s algorithms, helping establish the very correlations between reading attainment and eye movement patterns which set the foundations for Lexplore’s current AI analysis. Even the current analysis is refined as more tests are carried out, meaning the results themselves become more accurate and precise over time.
Frequently asked questions
My pupil has not shown any development, what has happened?

If you only look at the percentile number, in this case 50, it can appear pupils have not progressed between the testing periods. Each test shows that the pupil remains on the 50th percentile. This percentile value is correct and does actually show that a pupil has progressed as expected for their age, as Lexplore’s algorithms have taken the child’s expected progression into account during their analysis.
My pupil’s reading attainment has regressed despite a focus on reading throughout the term!

Throughout each term Lexplore’s algorithms increase the expectation they place upon a child’s reading attainment, meaning there will therefore be a small difference in difficulty between the autumn term and the spring term. If a pupil is tested very late in the autumn term and then very early in the spring term, it may appear that their reading attainment has dropped between the measurements.
In this case, the pupil was tested in December and the AI analysis gave a percentile value of 50. When the spring term started, the pupil had been tested at the end of February, showing a lower percentile value.
This does not necessarily mean that the pupil has regressed in terms of reading attainment. The AI analysis assumes that a pupil will develop his / her reading during the time between testing periods. If the pupil is tested too early, they will not have been able to develop their reading skills as would be expected.
With the third test taken a little later in the academic year, the pupil showed they had progressed at the rate the AI analysis had expected and their percentile value returned. We recommend schools stick to our regular testing periods to ensure results give a true and fair view of each pupil’s development.
My pupil shows continued regression.

Some pupils will experience difficulties when reading and writing. These can be very diverse and sometimes difficult to identify. In order for some pupils with specific difficulties, such as Dyslexia, to progress they may need extra support or
classroom tools to help them keep up with the teaching.
When pupils show a continued regression through repeated testing it can be a clear indication that the child is experiencing some sort of difficulty. Teachers should look closely at their results in terms of the individual reading components and eye movements patterns to determine if there is a specific area or phoneme structure the child is struggling with.
What next – how do I help pupils progress?

Lexplore’s results can offer a startling and unique insight into reading, which helps pinpoint those with specific difficulties in a matter of minutes. By measuring how the reading components work together we can offer teachers an objective analysis of a child’s natural reading ability by incorporating all the main cognitive processes involved. Each child’s results can then be broken down in our Results Portal into their individual components to highlight specific areas which might require more support.
Within each pupil’s reading profile, teachers can find dedicated interventions from our new and all-encompassing reading development and intervention programme, Lexplore Intensive. These have been pioneered by experienced SENCOs and literacy specialists to support and challenge pupils in line with our assessment outcomes.
With our entire test talking minutes, follow up assessments fit easily within the day to day activities of a school, and help teachers closely follow the outcome of targeted interventions.
There has been a fall in results after the Summer holidays.

Time away from the classroom over Summer can often cause reading skills to slide, especially as reading may become less frequent amongst the many holiday distractions.
Consequently, there can be some significant drops in reading percentiles when pupils are tested at the beginning of the new academic year.
But, drops in reading should not cause you to panic. Reading is a challenging skill which requires continual practice. If this is not done pupils may fall behind with their skills. This tends to be the case for pupils who haven’t yet developed strong skills and haven’t continued reading during the summer holidays.
Those pupils who have strong reading skills are more likely to continue reading over the holidays and so usually return having strengthened their skills further. The gaps between strong and weak readers can, therefore, increase during the
summer.
Once back into the classroom, pupils tend to quickly pick up where they left off and naturally get back on track with their reading. However, as a class teacher, it can be useful to organise some extra sessions with struggling pupils to help support them in getting started once more.
A pupil has not made linear progress
No pupils will follow a completely linear progression. Sometimes results can show little difference through repeated testing, then a pupil can appear to make huge improvements. Some children acquire their reading skills quickly, but for others the process is not straight forward and they can require more support.
The most important thing is to use Lexplore as a classroom tool, to back your professional judgments and also offer a new insight into a pupil’s literacy.
Thank you for reading! We hope you found this a useful guide. Don’t forget to check out our library of Additional Resources for more materials.