The measure is expressed on a scale between 0-and 1000. The lowest value corresponds to a pupil who cannot read at all and the highest corresponds to a very good reader at the end of primary school.
It is visualized so that the teacher can clearly see the pupil's own progression. This is a completely separate scale and not linked to any existing one. It is a complement to the pupil's percentile value.
Below is a picture of the Lexplore Score chart shown in the Results Portal. When you are logged in, you can hover your mouse over the dots to see the exact Lexplore Score the pupil received on their assessments. The curves in the diagram represent the five levels of reading ability.
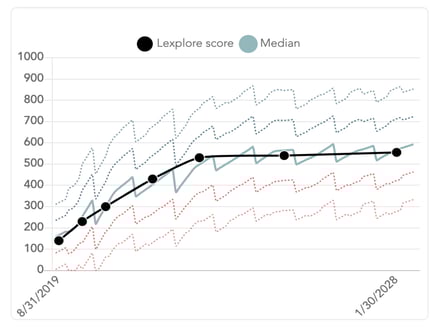
The reading development curve describes how the Lexplore score changes over time. The median curve shows the Lexplore score that an average pupil has at any given time. If a pupil follows their reading development curve, they develop at the same rate as everyone else, and their reading ability will increase. However, if the pupil's reading development does not progress at the same rate and continues within the average curve, then their percentile will remain the same.
In a scenario where the pupil's reading develops more slowly than their peers, the percentile will fall, if the pupil develops faster than others, the percentile will rise.
Read more in detail here about: The difference between Lexplore Score and Percentiles
🛎️Here at Lexplore, we love to help our users with their questions and provide self-help guides for quicker service. Please vote below on the Question of whether or not this article was helpful. 😊