
The Lexplore Score is a measure of reading ability. It includes both decoding and reading comprehension. The measure is expressed on a scale of 0–1000. The lowest value corresponds to a student who is just beginning to read, or a student who cannot read at all, while the highest value corresponds to a very good reader at the end of their schooling.
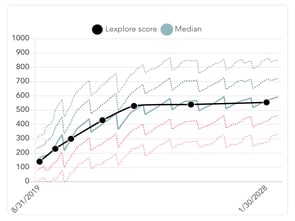
The reading development curve describes how the Lexplore Score changes over time. The median curve shows the Lexplore Score that an average student has at a given point in time. If a student follows their reading development curve, they are developing at the same pace as everyone else, and their reading ability will increase. As long as the student's reading develops at the same pace and stays on the average curve, the percentile will remain the same.
If the student's reading develops more slowly than their peers', the percentile will drop; if the student develops faster than others, the percentile will rise.
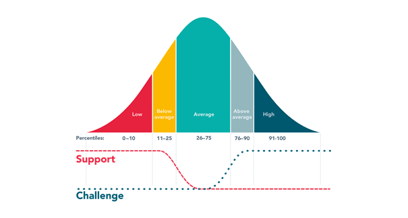
The percentile value shows how a student's Lexplore Score compares to other students at a given point in time. If a student reads better than 10% of all students, they get percentile 10, and if a student reads better than 90% of all students, they get percentile 90. An average student gets percentile 50, because their Lexplore Score corresponds to the average of all other students at the same point in time.
To follow up on an individual student's progress, the teacher can look at the Lexplore Score. To see the reading level of a class/school/student compared to the average in their country, you can look at the percentile.
You can read more about these topics here:
Reading age and Lexplore Score
🛎️Here at Lexplore, we love helping our users with their questions and offer self-help guides for faster service. Please vote below on whether this article was helpful. 😊